
In this post in the Classroom of the Future Blog Series, we’ll discuss how a community survey shaped by Voice of the Customer techniques helped the team uncover priorities among the needs and opportunities identified through previous ethnographic research.
During the third step in the Discovery process, we conducted a survey to learn about community members’ perceptions of the needs and priorities we had uncovered. To learn about how we had previously organized those needs, see Classroom of the Future Discovery 2: Organizing Insights.
In fall 2022, we invited Sloan faculty, students, and staff to participate in the Community Survey. The goal of the survey was to better understand how community members perceived the expressed needs’ importance and the school’s current performance in meeting those needs. We designed the survey based on the Voice of the Customer (VOC) process. We also benefitted from direct guidance from John R. Hauser, the Kirin Professor of Marketing at MIT Sloan.
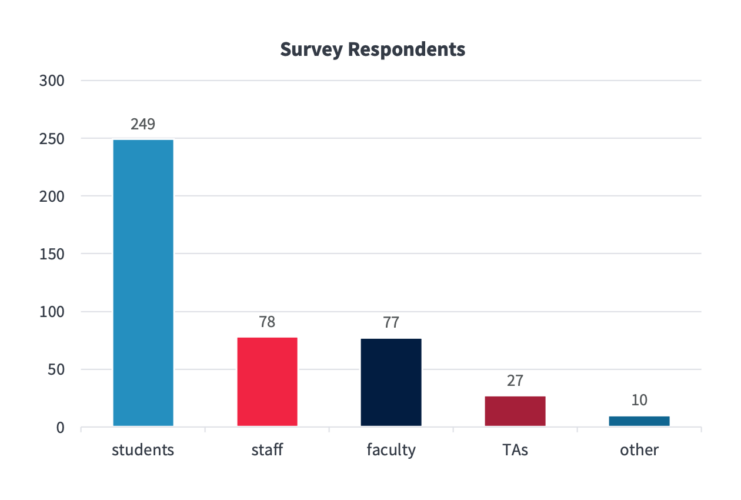
We received a total of 428 responses to the Community Survey. Respondents included 249 students, 78 staff, 77 faculty, 27 TAs, and 10 “other.” (Respondents could select more than one role.)
The survey results suggest that the school is already doing pretty well in meeting the expressed needs—and that there’s still plenty of room for improvement.
- The average importance rating for each expressed need is between 3 (“moderately important”) and 5 (“extremely important”) according to student, faculty, and/or staff respondents.
- The average performance rating across all 27 expressed needs and all respondents was 3.29. On the 1-5 scale used in the survey, that’s just above “moderately well.”
The survey also highlighted differences in respondent groups’ perceptions of certain expressed needs. For example, key groups of respondents shared very different perceptions of importance and performance for the expressed need, “Instructors can easily access classroom spaces that accommodate a wide range of instructional methods and class sizes.”
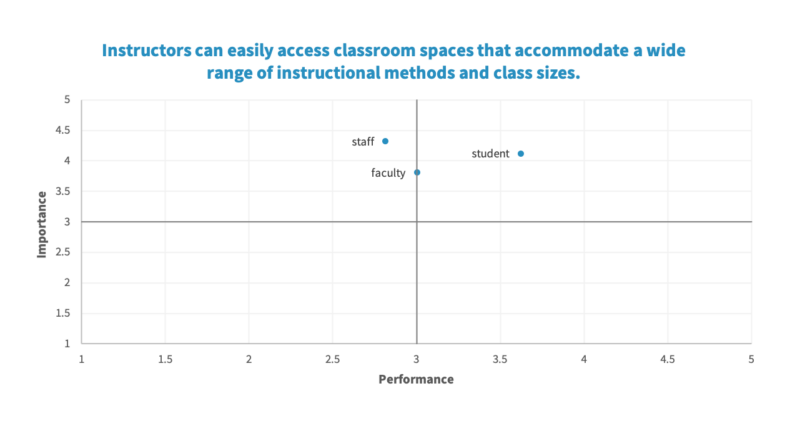
| Role | Average Performance | Average Importance |
| faculty | 3.00 | 3.81 |
| staff | 2.81 | 4.32 |
| student | 3.62 | 4.12 |
You can learn more about the survey results on pages 2-5 of the Needs Overview document.
Data from the Community Survey helped our team better understand how Sloan community members perceived both the specific expressed needs and the school’s performance in meeting those needs. In the next post, we’ll explore the following step: facilitating creative workshops where community members imagined possible solutions.